Having real-time insight into the performance and health of your server is crucial for ensuring its smooth operation and optimizing its resources. If you are a Linux user, then Munin can be your valuable ally in this endeavor. This article will guide you through the process of setting up Munin on your Linux system, enabling you to monitor various aspects of your server's functionality.
With Munin, you can gather and visualize important data such as CPU usage, memory utilization, network activity, and disk usage. It provides comprehensive graphs and charts that give you a clear overview of your server's performance over time, allowing you to identify potential bottlenecks, abnormal patterns, and areas for improvement.
The installation and configuration of Munin may initially seem daunting, but fear not - this article will provide you with a step-by-step guide, making the process smooth and straightforward. Whether you are a newbie or an experienced Linux user, this tutorial will equip you with the necessary knowledge to successfully set up and utilize Munin on your Linux system.
What is munin and why should you consider using it?

Monitoring your computer systems is crucial for ensuring their optimal performance and stability. Munin, a powerful and versatile monitoring tool, provides you with valuable insights into the health and status of your system and its various components. By collecting data from multiple sources and presenting it in user-friendly graphs, Munin enables you to easily identify trends, troubleshoot issues, and make informed decisions for the efficient management of your infrastructure.
- Gain comprehensive visibility: Munin offers a holistic view of your system by monitoring a wide range of system resources, such as CPU, memory, disk usage, network traffic, and more. This allows you to understand how each component is performing and detect any potential bottlenecks or anomalies.
- Identify trends and patterns: By regularly analyzing the historical data provided by Munin, you can identify patterns and trends in the performance of your system. This enables you to make informed predictions, plan capacity upgrades, and proactively address any potential issues before they impact the overall system stability.
- Facilitate troubleshooting: Munin's intuitive interface and visually appealing graphs make it easier to identify and diagnose system issues. Its comprehensive plugin ecosystem allows you to extend the monitoring capabilities to suit your specific needs, ensuring that you have all the necessary information at your fingertips to address any potential problems efficiently.
- Optimize resource allocation: With Munin, you can easily identify underutilized resources and optimize their allocation to achieve better performance and cost efficiency. By closely monitoring resource utilization trends, you can make informed decisions about the allocation of CPU, memory, and disk space, ensuring that your system operates at its full potential.
In summary, Munin provides a valuable monitoring solution for your Linux-based system, offering comprehensive visibility, trend analysis, troubleshooting capabilities, and resource optimization. By leveraging Munin's powerful features, you can maintain the health and stability of your system, make data-driven decisions, and improve the overall performance of your infrastructure.
Requirements
In order to successfully deploy and utilize Munin on your Linux-based operating system, it is essential to ensure that certain prerequisites are met. These prerequisites encompass a range of elements that are crucial for the smooth functioning of Munin and its associated components.
- A compatible operating system that supports the installation and operation of Munin.
- An appropriate version of the operating system, as certain versions may have compatibility issues.
- Access to the root or administrative privileges to install and configure the necessary packages.
- A stable internet connection to download the required software packages and updates.
- Sufficient disk space to accommodate the installation files, logs, and data generated by Munin.
- Adequate memory and processing power to handle the monitoring and graphing tasks performed by Munin.
- An installed and properly configured web server to host the Munin web interface.
- Basic knowledge of command-line operations for executing various installation and configuration commands.
- Familiarity with network protocols and ports to ensure seamless communication between Munin nodes.
Meeting these requirements will lay the foundation for a successful implementation of Munin, allowing you to monitor and analyze the performance of your Linux system efficiently and effectively.
Requirements for Munin Installation
Setting up Munin on your operating environment requires a few necessary components and prerequisites. By understanding the essential requirements, you can ensure a smooth installation process and efficient monitoring of your Linux system's performance.
In order to establish a functional Munin setup, it is crucial to have the requisite tools and resources readily available. These include the necessary packages, dependencies, and hardware specifications. By meeting these requirements, you can guarantee the seamless installation and operation of Munin on your Linux system.
Additionally, proper configuration and optimization play a vital role in the successful implementation of Munin. Understanding the best practices for tweaking and fine-tuning the monitoring system allows you to achieve optimal performance and accuracy in collecting and displaying system statistics.
Furthermore, integrating Munin with compatible plugins and extensions is crucial for expanding its monitoring capabilities. By utilizing these additional resources, you can monitor various aspects of your Linux system beyond basic system metrics, providing a comprehensive overview of its performance and ensuring effective troubleshooting and analysis.
In summary, this section will guide you through the necessary software, hardware, configuration, and integration requirements for setting up Munin on your Linux system. By fulfilling these prerequisites, you can establish a robust and efficient monitoring environment that empowers you to track and analyze your system's performance effectively.
Installation
The process of setting up Munin on a Linux environment entails the necessary steps to install and configure the monitoring tool. This section focuses on guiding users through the proper installation procedure, enabling them to efficiently utilize the capabilities of Munin within their system.
Within this section, we will explore the steps required to deploy Munin onto the selected Linux distribution. This encompasses the installation of essential packages and dependencies, along with the configuration of various settings to ensure seamless integration with the system.
The installation process entails multiple stages, starting with the retrieval of the necessary installation files. With the files in hand, users will then proceed to prepare the system, ensuring compatibility and resolving any missing dependencies. Following the complete preparation of the environment, the actual installation can be initiated. The steps involved here may vary depending on the specific distribution being used.
In addition to the primary installation, this section will also cover the post-installation steps required to fine-tune the Munin setup. This may include configuring the monitoring system to target specific resources within the Linux environment, adjusting settings for optimal performance, and enabling secure access to the Munin interface.
By the end of this installation section, users will have a fully functional Munin setup on their Linux system, ready to effectively monitor and collect data on various aspects of their infrastructure.
A Comprehensive Guide to Installing Munin on Your Linux OS
Do you desire a straightforward solution to monitor the performance of your Linux operating system? Look no further, as this step-by-step guide will walk you through the installation process of Munin - a powerful monitoring tool that provides detailed insights into the vital metrics of your system. By following the instructions outlined below, you'll have Munin up and running in no time, allowing you to effortlessly keep track of key system parameters and identify potential issues.
| Step | Description |
|---|---|
| 1 | Start by updating your Linux OS to ensure you have the latest packages and dependencies. |
| 2 | Next, download and install the Munin package from a trusted repository, or compile it from source code for a customized installation. |
| 3 | Configure Munin by modifying the munin.conf file, which allows you to specify the system components and parameters to monitor. |
| 4 | Install the necessary plugins for Munin to collect data on various aspects of your system, such as CPU usage, memory usage, network traffic, and disk space. |
| 5 | Ensure Munin runs automatically on system startup by configuring it as a service or adding it to the startup scripts. |
| 6 | Access the Munin web interface to visualize the collected data through interactive graphs and charts. |
| 7 | Customize the appearance and functionality of Munin by exploring available themes and plugins. |
| 8 | Maintain and troubleshoot Munin by regularly updating the software and resolving any issues that may arise. |
By following this comprehensive guide, you will be equipped with the necessary knowledge to successfully install Munin and harness its full potential for system monitoring and performance optimization. Embrace the power of Munin to gain valuable insights into the health and efficiency of your Linux environment.
Configuration
In this section, we will explore the various steps involved in customizing the settings of your monitoring system. The configuration process entails adjusting the parameters and options to tailor the functionalities to suit your specific needs.
One crucial aspect of configuring the monitoring system is fine-tuning the performance settings. By optimizing the parameters, you can ensure efficient utilization of system resources while minimizing any potential impact on system performance.
Additionally, you will have the opportunity to personalize the appearance of the monitoring system. This involves customizing the layout, color schemes, and widgets to create a visually appealing and user-friendly interface.
Another aspect of configuration is defining the monitoring targets. You can specify the hosts, services, or applications that need to be monitored. This process involves setting up the necessary connections and obtaining the required credentials or permissions.
Furthermore, configuring alerts and notifications is essential to stay informed about any critical events or issues. By setting up appropriate alert rules and notifications, you can ensure timely responses and proactive actions to maintain the stability and security of your system.
| Configuration Steps |
|---|
| 1. Performance Optimization |
| 2. Personalization |
| 3. Defining Monitoring Targets |
| 4. Alerts and Notifications |
Setting up and customizing munin to meet your unique requirements
When it comes to monitoring and managing your system, having a reliable and customizable solution is crucial. In this section, we will explore the process of setting up and customizing munin, a powerful monitoring tool, tailored to your specific needs.
Installation and configuration:
Before customizing munin, it is essential to ensure its proper installation and configuration. This involves deploying munin on your Linux-based system and configuring it to monitor various aspects such as system resources, network traffic, and application performance. We will discuss the steps required to set up and configure munin effectively.
Choosing the right plugins:
Munin offers a vast array of plugins that allow you to monitor different aspects of your system. It is essential to select the plugins that are most relevant to your specific requirements. We will explore various plugins available, their functionalities, and how to choose the ones that align with your monitoring goals.
Customizing graphs and visualizations:
Munin provides a variety of graphing options to represent the collected data in a visually appealing and meaningful manner. We will discuss techniques to customize and enhance the graphs to suit your preferences and requirements. This includes adjusting colors, scaling, adding labels, and incorporating time ranges.
Creating custom plugins:
In addition to the built-in plugins, munin allows you to develop custom plugins to monitor specific aspects of your system. We will explore the process of creating custom plugins, using scripting languages like Python or Bash, and integrating them seamlessly into your munin setup.
Alerting and notification:
Efficient monitoring goes beyond visual representation of data; it involves timely alerts and notifications when anomalies occur. We will delve into the various alerting mechanisms that can be configured within munin, ensuring that you are promptly notified of any critical events or thresholds being reached.
Integration with other tools:
Munin can be integrated with other tools in your system management arsenal, providing a holistic monitoring solution. We will discuss the possibilities of integrating munin with popular tools like Nagios, Grafana, or Prometheus, enhancing your overall monitoring capabilities.
Continuous improvement and scalability:
As your system evolves, your monitoring requirements will change as well. We will explore strategies and best practices for continuously improving and scaling your munin setup to accommodate new services, fine-tune monitoring parameters, and ensure its effectiveness in the long term.
By following the steps outlined in this section, you will be able to set up and customize munin to fit your specific needs, providing valuable insights into your Linux-based system's performance and health.
Data Gathering
In the realm of monitoring and managing a Linux-based environment, the process of collecting data serves as the foundation for meaningful insights and informed decision-making. Through various methods and techniques, information is fetched from different sources within the system, enabling administrators to gain a comprehensive understanding of its performance, resource utilization, and potential bottlenecks.
The first step in the data gathering process involves identifying the key metrics and parameters that need to be monitored. These metrics can include CPU usage, memory utilization, disk I/O, network traffic, and more. Once the metrics are determined, the next step is to configure the system to collect and store the relevant information.
- Log Files: Logging is an essential component of data gathering, as it allows for the continuous recording of important events and measurements. By analyzing logs, administrators can pinpoint errors, track system behavior over time, and troubleshoot issues effectively.
- Sensors: Many Linux systems offer sensor data, such as temperature, voltage, and fan speed, through hardware monitoring devices. Collecting this information provides valuable insights into the health and well-being of the system's physical components.
- APIs and Interfaces: Certain software applications and services expose APIs or interfaces that allow for direct interaction and data retrieval. By utilizing these interfaces, administrators can extract information about processes, resource utilization, and other vital system details.
- Database Queries: In cases where data is stored in databases, executing queries can retrieve valuable information for monitoring purposes. Whether it is fetching system statistics, analyzing historical trends, or generating custom reports, database queries play a crucial role in gathering relevant data.
Through a combination of these data gathering methods, administrators can establish a holistic understanding of their Linux systems, enabling them to make informed decisions regarding performance optimization, resource allocation, and overall system health.
Collecting and Storing Data: An Insight into munin's Data Gathering Process
In this section, we delve into the intricacies of how munin effectively captures and archives vital information from your operating environment. By employing a diverse range of methods and techniques, munin seamlessly acquires, compiles, and stores a comprehensive range of data, providing valuable insights into the performance and health of your system.
At the core of munin's data collection lies a sophisticated framework that expertly retrieves and aggregates statistics from various sources within your infrastructure. Using a multitude of ingenious algorithms, munin intelligently gathers relevant metrics, encompassing CPU utilization, memory usage, disk I/O, network traffic, and more, ensuring a holistic view of your system's performance.
To facilitate this data acquisition process, munin employs a well-organized architecture consisting of multiple components working in harmony. These components, referred to as munin nodes, act as agents responsible for gathering data from individual hosts within the network. Each munin node diligently collects and forwards pertinent information to a central server, known as the munin master, creating a unified repository of system metrics.
The communication between the munin nodes and munin master occurs through a lightweight and efficient protocol, guaranteeing swift data transmission and minimal network overhead. This robust mechanism permits the munin master to seamlessly retrieve data from all connected nodes, enabling comprehensive analyses and generating visually appealing graphs and charts.
| Data Acquisition Methods | Data Sources | Data Storage |
|---|---|---|
| Direct Polling | CPU, memory, disk usage, network interface statistics | Round-robin database (RRD) |
| SNMP Queries | Router, switch, and network device statistics | RDDTool backend storage |
| Plugins and Scripts | Custom applications, databases, specialized services | MySQL, PostgreSQL, or other external databases |
To ensure optimal performance and flexibility, munin employs various data storage options depending on the type of information collected. For standard system statistics, munin utilizes round-robin database (RRD) files, which efficiently store time-series data points in a compact format. SNMP data from network devices is stored utilizing the RDDTool backend storage mechanism. For more complex or customized metrics, munin seamlessly integrates with external databases such as MySQL or PostgreSQL, providing unparalleled flexibility in data storage and analysis.
The culmination of munin's data collection process is its ability to generate visually appealing graphs and charts. By skillfully representing the acquired metrics, munin empowers system administrators to identify trends, analyze historical data, and pinpoint potential bottlenecks or anomalies. These informative visualizations play a crucial role in efficiently managing and optimizing your Linux system.
With munin's comprehensive data gathering capabilities and intuitive visual representation, you gain valuable insights into the intricate workings of your Linux environment. The seamless integration of diverse data sources and the flexible storage options ensure a holistic view of your system's performance, enabling proactive monitoring and facilitating efficient decision-making processes.
Monitoring: Ensuring the Health and Performance of your Environment
In today's fast-paced digital world, it is imperative to constantly monitor and assess the health and performance of your environment, ensuring its smooth operation and optimal functionality. Effective monitoring allows you to stay informed about potential issues, identify trends, and make informed decisions to improve the overall stability and efficiency of your system.
Monitoring involves continuously observing the various components and processes within your environment, including servers, networks, applications, and databases. By monitoring these elements, you can proactively identify bottlenecks, performance degradation, and any potential security vulnerabilities, allowing you to take appropriate actions in a timely manner.
A key aspect of monitoring is the collection and analysis of data from various sources. This data is then visualized in the form of graphs, charts, and reports, providing valuable insights into the overall health and performance of your system. Additionally, monitoring tools often include alerting mechanisms to notify administrators in real-time when predefined thresholds or anomalies are detected.
When setting up monitoring in your environment, it is essential to choose a reliable and comprehensive monitoring solution that meets your specific requirements. Such a solution should offer flexibility, scalability, and compatibility with different operating systems and technologies. Additionally, it should provide customizable dashboards, easy data retrieval, and the ability to integrate with other tools and systems.
Overall, monitoring plays a critical role in ensuring the stability, security, and performance of your environment. By implementing a robust monitoring strategy, you can proactively address potential issues, optimize resource allocation, and make data-driven decisions to enhance the overall efficiency of your system.
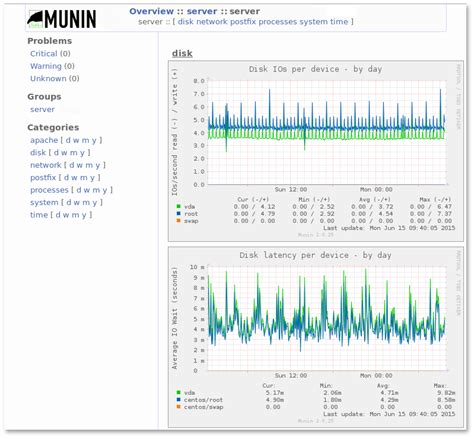
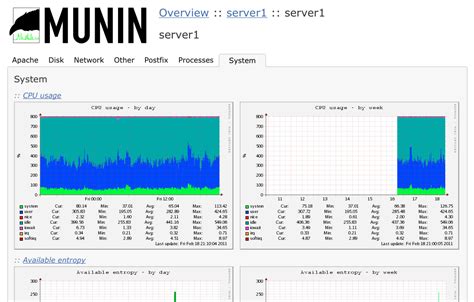
Using the munin web interface to monitor your machine's performance
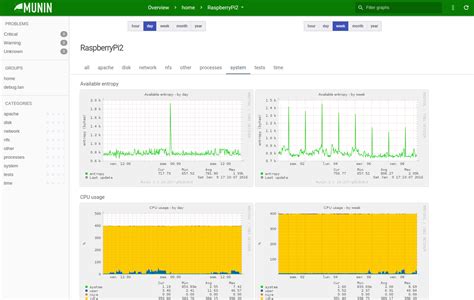
Discover insights into the performance of your machine using the powerful munin web interface. Gain a comprehensive view of various system metrics and analyze their trends and patterns to optimize your machine's efficiency and identify any potential issues.
Gain an Overview of Performance: The munin web interface allows you to conveniently access and visualize essential system metrics, such as CPU usage, memory consumption, disk utilization, network traffic, and more. Monitor these metrics in real-time or review historical data to identify performance trends and patterns.
Analyze Trends and Patterns: With munin, you can analyze the historical data collected by the monitoring system. Identify long-term patterns in the performance of your machine and gain insights into how different factors, such as system load or resource usage, affect its overall performance.
Customize Your Monitoring: Munin offers a high degree of configurability, allowing you to tailor its monitoring capabilities to suit your specific needs. Select the metrics you want to track, choose the time intervals for data collection, and set up alerts to receive notifications when certain thresholds are exceeded.
Compare Performance Across Multiple Machines: If you have multiple machines running munin, take advantage of the web interface to compare and contrast their performance metrics. Identify any disparities or similarities between machines and make informed decisions regarding resource allocation and optimization strategies.
Enhance Troubleshooting and Optimization: When troubleshooting or optimizing your machine, the munin web interface serves as a valuable tool for identifying bottlenecks and performance issues. Monitor specific components or processes, track their behavior over time, and use the collected data to guide your optimization efforts.
Accessible Data Visualization: Munin presents complex system metrics in a user-friendly and visually appealing format. Utilize interactive graphs and charts to view and interpret performance data effortlessly, empowering you to make informed decisions and take proactive steps towards enhancing your machine's performance.
Experience the power of munin's web interface to effortlessly monitor your machine's performance and gain valuable insights into its behavior and optimization possibilities.
Alerts and Notifications
In this section, we will explore the important role of alerts and notifications in managing and monitoring your Linux environment with munin. Keeping track of system performance and resource utilization is crucial for maintaining the stability and reliability of your system.
Alerts serve as early warning indicators, helping you identify potential issues before they escalate into major problems. By configuring alerts, you can proactively take necessary actions to prevent system failures, optimize performance, and ensure smooth operation.
| Alert Type | Description |
|---|---|
| Threshold Exceeded | Alert triggered when a specific metric exceeds a predefined threshold. For example, CPU usage exceeding 90%. |
| Trend Analysis | Alert triggered when there is a significant deviation from the normal performance trends. For example, rapid increase in memory usage over a short period. |
| Service Availability | Alert triggered when a monitored service is down or experiencing issues. For example, web server not responding to requests. |
Munin provides flexible options for setting up alerts and notifications, allowing you to define thresholds, specify alert recipients, and choose the preferred method of notification, such as email, SMS, or system log messages. By configuring these alerts effectively, you can ensure prompt response to potential problems and minimize system downtime.
Additionally, munin allows you to customize the frequency of alert checks, specify escalation rules, and implement automated actions based on specific conditions. This flexibility empowers you to tailor the alerting system to your specific needs and ensure timely intervention when necessary.
In the next section, we will delve into the process of configuring alerts and notifications in munin, providing step-by-step instructions to help you optimize system monitoring and management.
How to Install Munin in Ubuntu
How to Install Munin in Ubuntu by LinuxHelp 5,543 views 7 years ago 9 minutes, 45 seconds
FAQ
What is munin and why should I set it up on my Linux system?
Munin is a networked resource monitoring tool that helps you monitor the performance of your Linux system. By setting up munin, you can easily keep track of various system resources such as CPU usage, memory usage, disk space, network traffic, and more. It provides valuable insights into your system's health and helps you identify and resolve any performance issues.
How do I install munin on my Linux system?
To install munin on your Linux system, you can use the package manager specific to your distribution. For example, on Debian/Ubuntu systems, you can run the command "sudo apt-get install munin". On CentOS/RHEL systems, the command would be "sudo yum install munin". Once the installation is complete, you will need to configure munin and its plugins to start monitoring your system.
What are munin plugins and why are they important?
Munin plugins are small scripts or programs that gather data about specific resources on your Linux system. These plugins are essential for munin because they provide the data that is displayed in the monitoring graphs and charts. Without properly configured plugins, munin won't be able to collect the necessary data to monitor your system's performance accurately.
Can I access munin's monitoring graphs from a web interface?
Yes, munin provides a web interface that allows you to access its monitoring graphs. These graphs provide visual representations of various system resources over time. By accessing the web interface, you can view historical data, compare performance metrics, and gain insights into the trends and patterns that may affect your system's performance.


